
In the previous post of the Personal Finance Basics series we covered how the stock market works.
In this post, we’ll build on that understanding to understand what the S&P 500 and the Dow are.
If you read through the business section of a newspaper, you might encounter headlines such as:
S&P 500 Slips After Earnings From Macy’s and Kohl’s
or
Dow drops nearly 200 points on losses for Cisco, Intel stocks
If you’ve ever wondered what the heck the S&P 500 or the Dow are and why these klutz-balls keep slipping and dropping, you’re in the right place.
The S&P 500
The S&P 500 is an index tracking the performance of 500 prominent companies listed on stock exchanges in the United States.
If this is meaningless to you, don’t worry—we’ll break down each part of this definition until it makes sense.
Why S&P and 500?
Let’s start by breaking down the name.
The “S&P” in S&P 500 stands for Standard and Poor’s. Standard and Poor’s is the name of the company that created the S&P 500.
The “500” in S&P 500 stands for the 500 public companies (think Apple, Microsoft, Amazon, Tesla, etc.) that make up the S&P 500.
What is an index?
Now we can break down the meaning of an index.
An index is simply a number that measures change over time for a specific group of items.
The consumer price index (CPI), for example, measures how prices for typical consumer products (food, electricity, gasoline, clothing, medical care, etc.) change over time.
In August 1983, the CPI was 100.
In July 2022, it was 295.
This means that from 1983 to 2022 the price of typical consumer goods and services increased by a factor of 2.95.1
In other words, a basket of these typical consumer goods that cost $10 in 1983 would cost $29.50 in 2022.
The S&P 500, similarly, is a number that measures the change over time (performance) for a specific group of items (the 500 public companies in the index).
What is a stock exchange?
The last part to break down is the bit about listed on stock exchanges in the United States.
When you want to buy apples, broccoli, or lentils, you go to your local grocery store.
When you want to buy a share of Apple stock, you go to a stock exchange.
You can do this online, as most things nowadays, while sitting on the couch wearing your penguin onesie 🐧 simply by logging into a stockbroker such as Vanguard or Fidelity.
We’ll cover this in more detail in future posts, but for now it’s enough to know that:
- You can buy shares of any public company (e.g., Apple, Microsoft, Amazon, Tesla, etc.) through a stock exchange.
- There are lots of different stock exchanges.
- The NYSE (New York Stock Exchange) is the world’s largest. Home Depot, Walmart, and Visa, among other companies, are listed on the NYSE. If you want to buy shares of these companies, you’ll do so through the NYSE.
- The NASDAQ (also based in New York City) is the second largest. Apple, Microsoft, and Amazon (along with almost every other tech company) are listed on the NASDAQ.
- The Shanghai Stock Exchange is the third largest. Since this is not a stock exchange in the United States, no company listed in the Shanghai Stock Exchange is part of the S&P 500.
Sidenote
You can go online and easily buy shares of any company listed on any stock exchange so the location of the stock exchange doesn’t matter much in today’s Internet-connected world.
Location was more important in the pre-Internet days when stock trading was done by physically exchanging pieces of paper which required the stock traders to be in the same building.
This is a big part of the reason why New York is the world’s financial capital. For a long time, it was the place to be if you wanted to be a stock trader.
Swipe right
One last thing to note about the S&P 500 is that companies are added and removed every year.
For example, Match Group (owners of Tinder, Hinge, and basically every other dating app) was added in September 2021, replacing Perrigo (a pharmaceutical company).
You can see the 500 companies currently in the S&P 500 on Wikipedia.
The S&P 500 over time
Here’s how the S&P 500 has changed from 1980 to 2022:
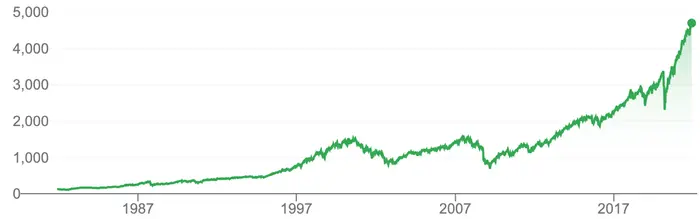
The S&P 500 has gone from 122 in November 1980 to 4,231 in August 2022. That’s an increase by a factor of 34.7.2
This means that if you had invested $1,000 into the S&P 500 in November 1980, you’d have $34,700 in August 2022.
Not too shabby.
The definition of the S&P 500
Here’s the definition again:
The S&P 500 is an index tracking the performance of 500 prominent companies listed on stock exchanges in the United States.
This should now mostly make sense.
As a summary:
- Standard and Poor’s (S&P) created an index to track 500 prominent companies.
- These companies are listed in U.S. stock exchanges (like the NYSE or the Nasdaq.)
- This index is expressed as a number and measures the performance of the 500 companies—as a whole—over time.
- The index goes up when the value of the companies in the index goes up.
- The index goes down when the value of the companies in the index goes down.
- You see that dip around 2000 in the chart above? That’s the dot-com crash.
- The dip around 2008? That’s the Great Recession.
- The dip around 2020? That’s COVID-19.
So when we now read the newspaper headline:
S&P 500 Slips After Earnings From Macy’s and Kohl’s
We know that the S&P 500 was lower on that day than on the day before after Macy’s and Kohl’s (two of the companies in the index) reported their earnings.3
Sidenote
It’s likely that the profit reported by Macy’s/Kohl’s wasn’t very good. The poor profit probably led investors to sell their shares of these companies.
This decreased demand led to a decrease in the price of the shares and, by proxy, to a decrease in the S&P 500.
The Dow
The story is much the same for the Dow.
Here’s the definition:
The Dow is a stock market index of 30 prominent companies listed on stock exchanges in the United States.
The Dow is a subset of the S&P 500. In other words, all 30 companies in the Dow are also in the S&P 500.
How is the Dow different from the S&P 500?
- It was created by Charles Dow, founder of the Wall Street Journal, hence the name.
- It includes only 30 companies rather than 500.
- These 30 companies are chosen based on the judgement of the editors of the Dow rather than on a set of criteria (like the S&P 5004)
- It’s much easier to calculate.
Here’s how the Dow has changed from 1980 to 2022:
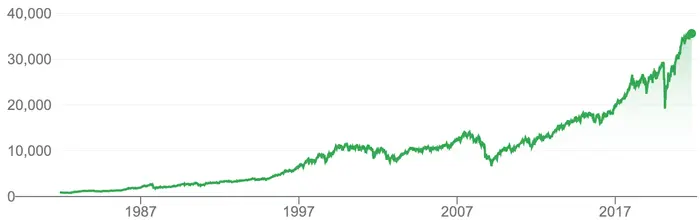
The Dow (also called the Dow Jones Industrial Average or DJIA) has gone from 853 in November 1980 to 33,500 in August 2022.
That’s an increase by a factor of 39.35, which is in line with the increase of the S&P 500.
How is the Dow calculated?
I mentioned above that the Dow is much easier to calculate.
To do so, all we have to do is sum up the stock price of each of the 30 companies and divide this number by the Dow Divisor.
DJIA = sum of the stock price of all 30 companies ÷ Dow Divisor
The Dow Divisor is currently 0.1517 and only changes when a company in the index is replaced6 or does a stock split.7
This means that each $1 change in stock price for any of the 30 companies leads to a 6.598 point change in the Dow.
By way of example, if a share of Apple increases by $8, Apple would be contributing a 52.79 point increase to the Dow on that day.
This increase for Apple would then be combined with the increase or decrease for the other 29 companies in the Dow to arrive at the final daily change.
Dow drops nearly 200 points
When we now read the newspaper headline:
Dow drops nearly 200 points on losses for Cisco, Intel stocks
We know that the Dow dropped 200 points because the stock price of Cisco and Intel (two of the companies in the Dow) went down.
This 200 point drop is equivalent to a $30.34 drop.10
This means that the combined change in stock price for the 30 companies of the Dow was a decrease of $30.34.
Summary
There you have it.
You can now confidently skim the Wall Street Journal while sipping your morning coffee as you bask in your newfound understanding of the S&P 500 and the Dow.
Become comfortable with interpreting these indices because they’re key for understanding the upcoming posts.
And don’t worry if everything here hasn’t fully sunken in yet—it takes time.
I hope this was helpful. Send me an email if you have any questions.
And if you’re looking to learn more, you can check out the whole Personal Finance Basics Series.
Video for this post
If you prefer watching to reading, here’s an easy-to-follow video I made with all this info:
Slides for this post
If you’re interested, check out the slides I made for the video.
Stay in touch!
Enjoying so far? Get my posts delivered straight to your inbox each week. 📨
*If this form gives you any trouble, reach out to me at hi@pathtosimple.com and I’ll help you out.
Footnotes
-
295 ÷ 100 = 2.95 ↩
-
4,231 ÷ 122 = 34.7 ↩
-
In other words, how much money they made in the previous quarter. ↩
-
Check out the S&P U.S. Indices Methodology PDF from S&P Global for the eligibility criteria for the S&P 500. ↩
-
33,500 ÷ 853 = 39.3 ↩
-
For example when Apple replaced AT&T in 2015. ↩
-
For example when Apple did a 4-for-1 stock split in 2020. ↩
-
1 ÷ 0.1517 = 6.59 ↩
-
8 ÷ 0.1517 = 52.7 ↩
-
200 × 0.1517 = 30.34 ↩